|
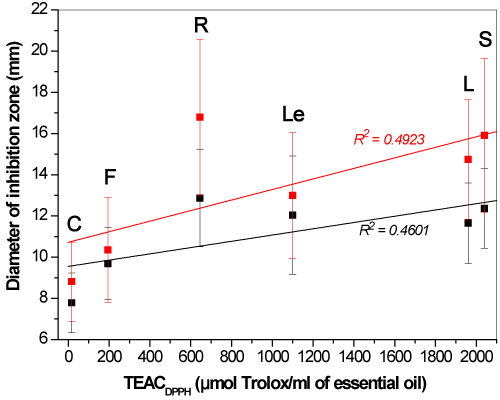
| Figure 4: Plot of the average value (with standard deviations as error bars) of the diameter of inhibition zone observed for Gram-negative (black symbols) and Gram-positive (red symbols) bacteria as a function of the corresponding observed average TEACDPPH values for all six basil essential oils studied [Red (R), Small-leaved (S), Large-leaved (L), Lettuce-leaved (Le), Lettuce-leaved Flower (F), Cinnamon (C)]. Linear fits to the data are shown superimposed. |