 |
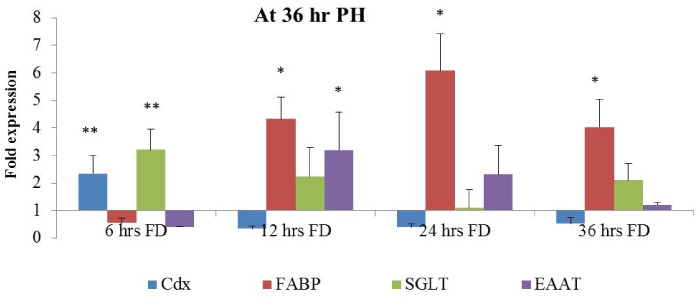
| Figure 1: Relative fold expression of Cdx, FABP, SGLT and EAAT gene at 36 hrs pH in the intestinal tissues of control and feed deprived chicks. Expression of Control group is taken as 1.0 * and **indicates significant expression at the level of 95% (P<0.05) and 99% (P<0.01), respectively. |