 |
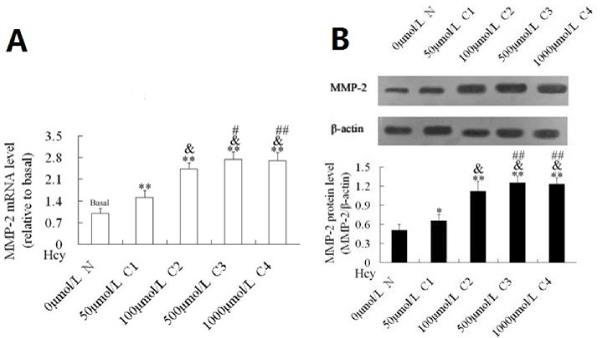
| Figure 2: (A) Effects of different concentrations of Hcy on mRNA and protein expression of MMP-2 in VECs. VECs were treated with Hcy at different concentration for 48 h, the mRNA of MMP-2 was tested by Real-time PCR (Figure 2A), and MMP-2 protein was examined by western blot assay. (B) A: x ±s, n=9, **P<0.01 vs. (0 μmol/L Hcy); and P<0.01 vs. (50 μmol/L Hcy); #P<0.01 vs. (100 μmol/L Hcy); ##P<0.05 vs. (100 μmol/L Hcy) B: x ± s, n=5, *P<0.05,**P<0.01 vs. control (0 μmol/L Hcy); #P< 0.01 vs. (50 μmol/L Hcy); ##P<0.05 vs. (100 μmol/L Hcy). |