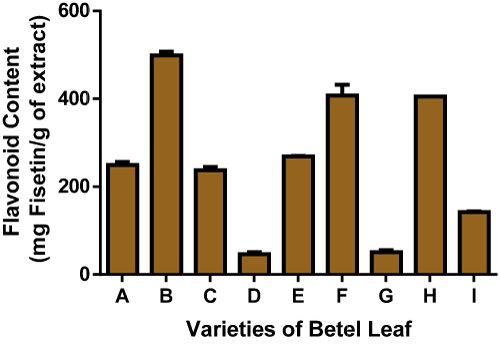
Figure 3:
Bar graph showing comparative flavonoid content of 9 varieties of
P.betle
leaves. Results expressed as fisetin equivalent (mg fisetin/gm) ± SEM of
P.betle
leaf extract, in duplicate.