 |
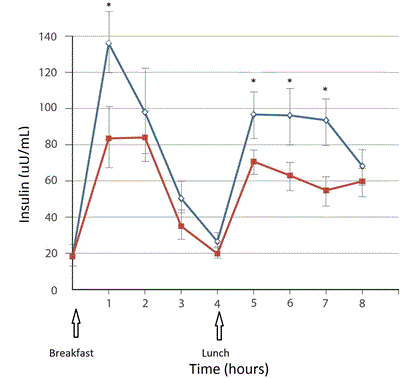
| Figure 1: Plasma insulin concentrations during standardized meal profiles (congruent with assigned dietary phase) administered over eight hours in subjects on the 60% (open diamonds) carbohydrate and 40% carbohydrate diets (solid diamonds). Breakfast was administered at time 0 hrs and lunch at time 4 hrs, indicated by arrows. *Indicates p<0.05 for individual time points. Overall p<0.02 for comparison of insulin area-under-the curve (AUC) according to dietary phase. |