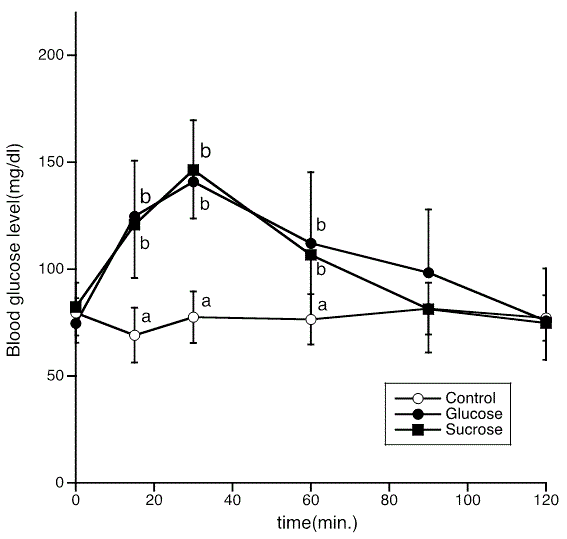
Figure 2
: Changes in blood glucose levels after the administration of 50 g. of sucrose or glucose to young men. Control group took water. a vs. b; p<0.05.