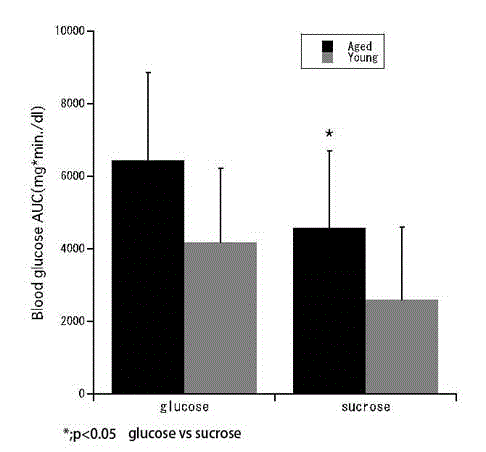
Figure 5
: The amounts of blood glucose after the administration of sucrose or glucose to young men or old men. Bar represent standard deviation and * represents p<0.05.