 |
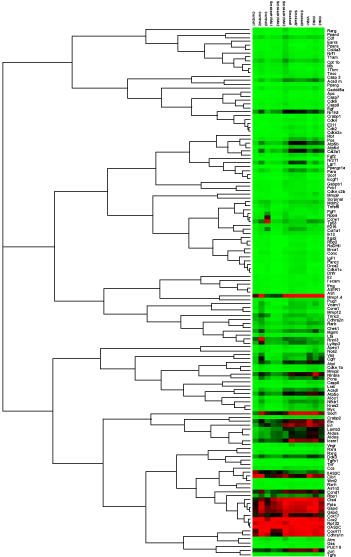
| Figure 1: Cluster analyses of the similarities of gene expressions in lungs among different groups. The column represents different treatment groups and the row represents different genes on each array. Red designates that genes were over expressed and green designates that genes were under expressed. |