 |
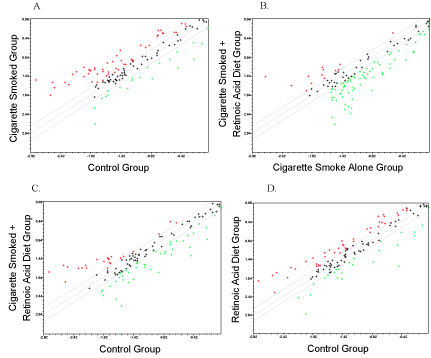
| Figure 2: Scatter plot of gene expression of lungs from different groups. Means of triplicate arrays were analyzed for each group. Data are shown as expression levels relative to Gapd, the house keeping gene. Genes above the upper line (red dots) are over expressed, and genes below the lower line (green dots) are under expressed by greater than a 1.5 fold between different groups. A. cigarette smoked group Vs control group; B cigarette smoked+retinoic acid diet group Vs cigarette smoke alone group; C. cigarette smoked+retinoic acid diet group Vs Control; D. retinoic acid diet group Vs control group. |