 |
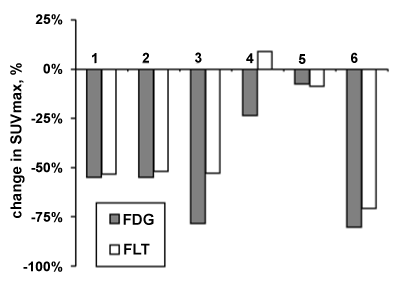
| Figure 5: A modified waterfall plot of change in SUVmax at 4 weeks (after induction therapy and 2 weeks of chemoradiotherapy) for each patient. The white bars represent FLT-PET, and the grey bars represent FDG-PET. The numbers along the X-axis correspond to the patient number. |