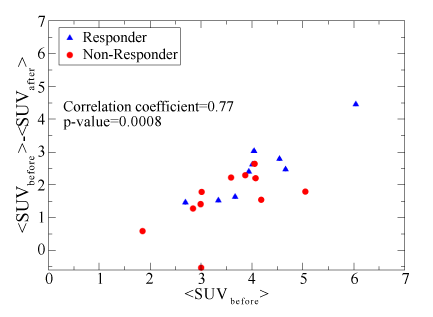
Figure 4:
Scatter plot of the difference <SUV
before
> – <SUV
after
> as a function of <SUV
before
>. A significant correlation is seen among those quantities.