 |
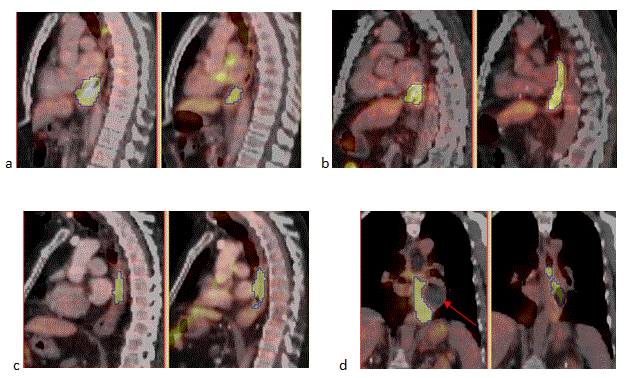
| Figure 3: FDG PET/CT images of four patients pre-CRT (left) and post-CRT (right). The contours indicate the original MAVs on pre- CRT images and residual MAVs on post-CRT images, respectively. (a) Patient 6, BinA = 100%, overlap = 33%, (b) Patient 4, BinA = 43%, overlap = 44%, (c) Patient 3, BinA = 37%, overlap = 53%, (d) Patient 2, BinA = 14%, overlap = 5%. |