 |
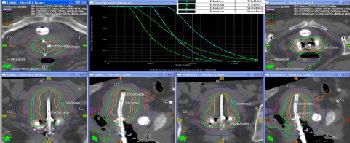
| Figure 1: Comparison of the isodoses on the axial, coronal, and sagittal images and the dose volume histogram for the customized and standard plan. The doses from the all 4 treatments delivered to patient #10 are displayed on the 1st fraction CT dataset. |