|
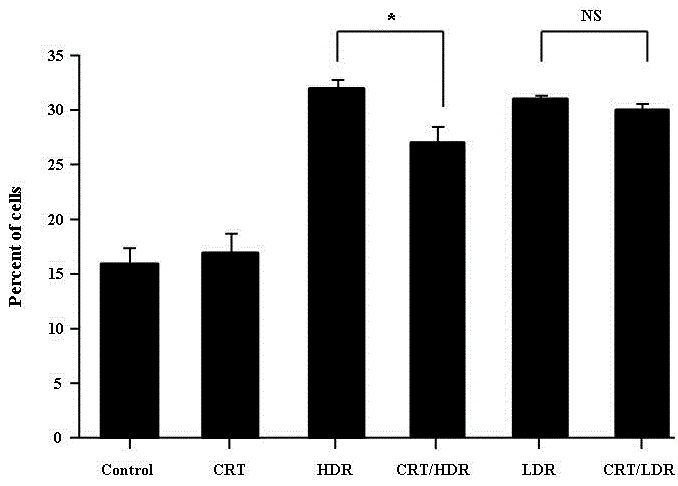
| Figure 4: The effects of X-IR and CRT treatment on G2/M accumulation. The effects on UVW cells of CRT and XBR at both dose-rates were assessed by FACS analysis and differences in G2/M accumulation induced by CRT and increasing XBR dose and doserate were assessed by 2-way ANOVA. Results show the mean ± sem of three separate experiments. Statistical significance: one (*) and three (***) symbols denote p<0.05 and p<0.0001 respectively. |