 |
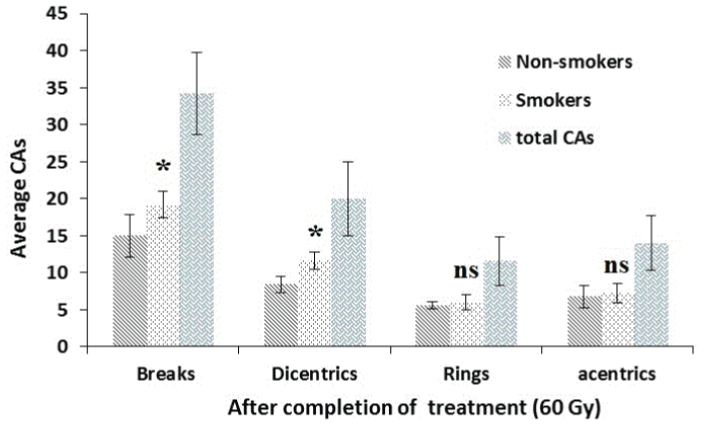
| Figure 3: Comparison of CAs in non-smoker (P1-P5) HNSCC patients with the smoker (P6-P10) HNSCC patients using Student’s t-test, after completion of treatment (i.e. 60 Gy). Each point indicates the mean ± SD of smokers and non-smokers. Note: *represent statistically significant differences between smoker and non-smoker patients at p<0.05; ns indicate a non-significant difference at p>0.05. |