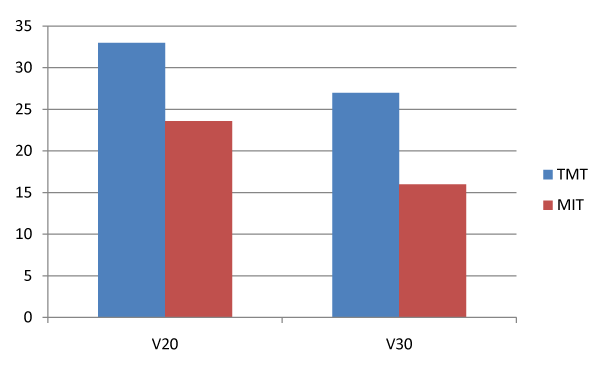
This graph shows the decrease of the percent of the volume received 20 Gy and 30 Gy by using the MIT
This graph shows the decrease of the percent of the volume received 20 Gy and 30 Gy by using the MIT |
| Chart 1: The percent of the lung volume received 20 Gy and 30 Gy for TMT and MIT. |