|
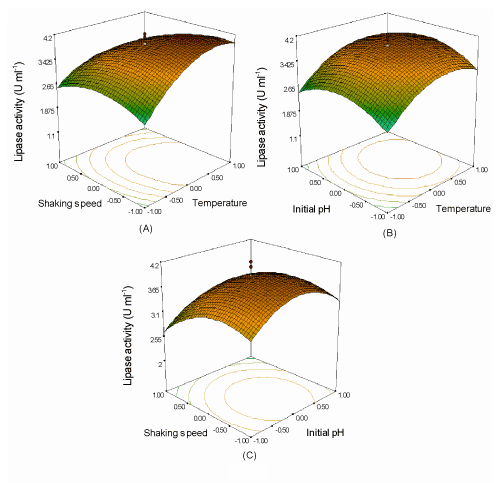
| Figure 2: Response surface plot and contour plots showing the effects of (A) temperature and agitation speed, (B) temperature and initial pH, (C) initial pH and agitation speed, on lipase production by R. arrhizus with the remaining factors kept constant at the middle level of the central composite experimental design. |