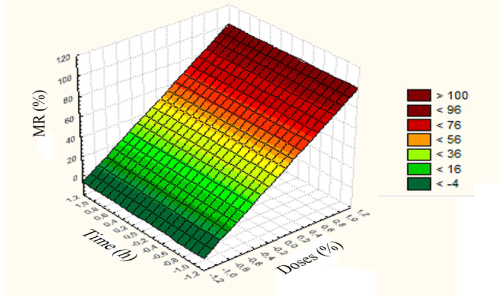
Figure 5
: Three -dimensional plot of MR (%) as a function of doses (%) and exposition time (h).