 |
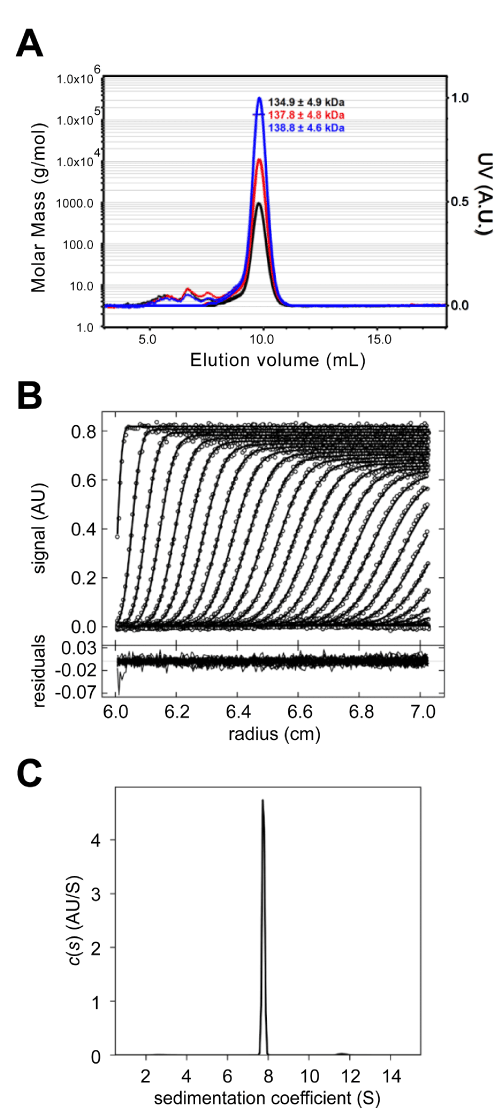
| Figure 4: SEC/MALS and AUC-SV analysis. (A) SEC/MALS profiles of 0.75 (black), 1.20 (red) and 1.65 mg/ml (blue) of HypBA1 proteins (100 μl per injection). The thin line segments represent the calculated molar masses and the corresponding molecular weights of each peak (left ordinate axis) are given in number with the unit of kDa. The solid lines represent normalized UV absorbance (280 nm, right ordinate axis) and dashed lines are signals of light scattering. (B) A typical tracing of absorbance at 280 nm of the data of HypBA1 during the sedimentation velocity experiment. The symbols (open circles) are experimental data and the lines are computergenerated results by fitting the experimental data to the Lamm equation using the SEDFIT program. The residuals of the model fitting were shown in the lower panel. (C) Sedimentation coefficient distributions resulting from the fitting in (B). The major peak is compatible with a dimeric form of HypBA1 with its hydrodynamic properties. |