 |
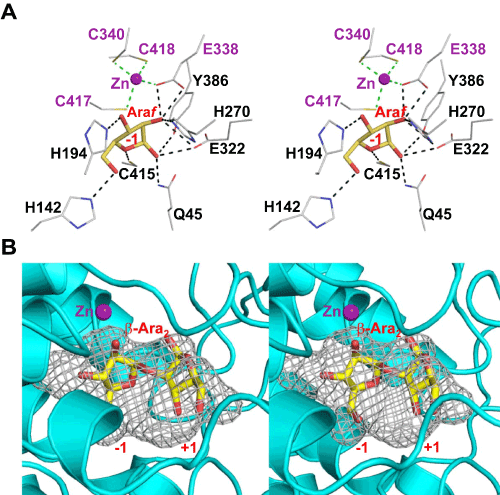
| Figure 5:The HypBA1 active-site. (A) Stereo view of the detailed interaction networks of active-site residues with Zn2+ ion and L-Araf. There are four coordinate bonds (green dash lines) and ten hydrogen bonds (black dash lines) between the active-site residues and the bound ligands. (B) The size and shape of the potential carbohydrate-binding cavity are calculated from the web server POCASA and shown as grey map with PyMOL. |