|
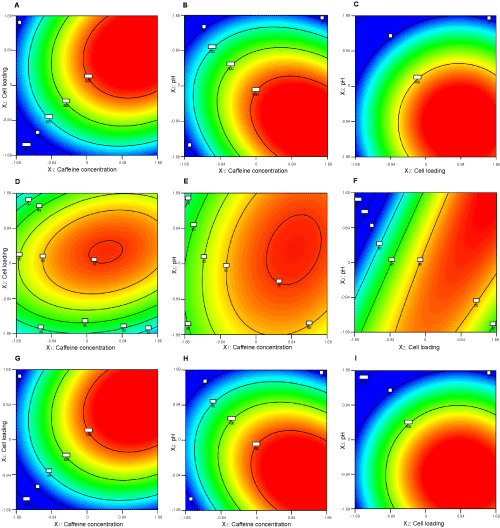
| Figure 2: Contour plots showing the effect reaction parameters on responses. (a) theobromine production at optimal pH, (b) theobromine production at optimal cell loading, (c) theobromine production at optimal caffeine concentration, (d) theobromine yield at optimal pH, (e) theo bromine yield at optimal cell loading, (f) theobromine yield at optimal caffeine concentration, (g) theobromine productivity at optimal pH, (h) theobromine productivity at optimal cell loading, (i) theobromine productivity at optimal caffeine concentration. |