 |
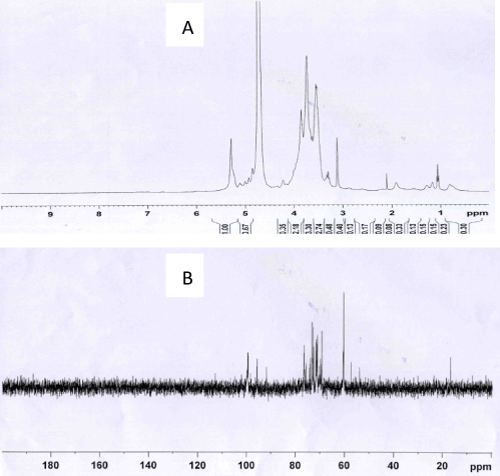
| Figure 4: NMR spectra of HSP-1 in D2O. (A) 1H NMR spectrum. The chemical shifted from 4.9 to 5.6 ppm corresponding to α configuration. The region shifted from 3.3 to 4.2 ppm was assigned to protons of carbons C2 to C6 of glycosidic ring. (B) 13C NMR spectrum. Six strong signals between 60 to 100 ppm were attributed to C1, C2, C3, C4, C5 and C6 of D-glucopyranosyl unit of the main (1→4)-linked a-D-Glup linkage. |