 |
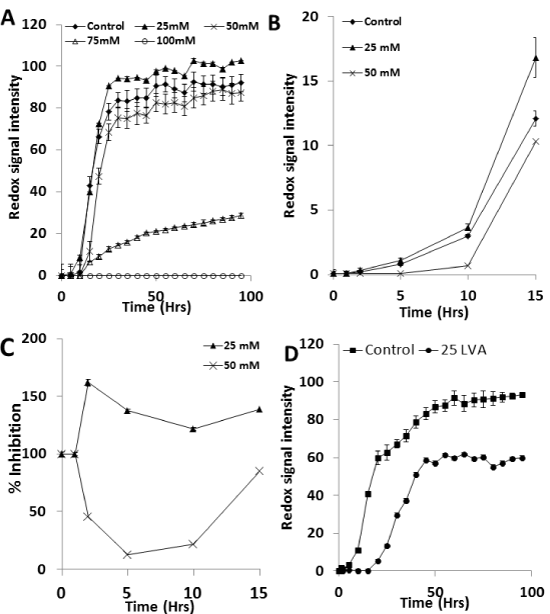
| Figure 1: (A) Metabolic output under 0-100 mM acetic acid for S. cerevisiae NCYC2592, (B) metabolic output for 0-50 mM acetic acid for S. cerevisiae NCYC2592 for 0-15 hrs, (C) % inhibition of metabolic output in the presence of 25 and 50 mM acetic acid when compared with under control conditions, (D) metabolic output under 0-25 mM levulinic acid for S. cerevisiae NCYC2592. Data representative of triplicate values (Mean SD=3). |