 |
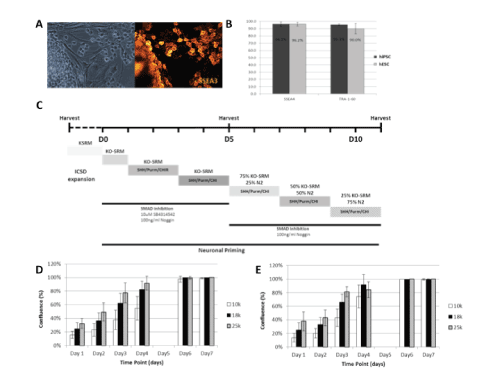
| Figure 1: A Phase contrast image of iPS colony (magnification × 10, scale bar = 400 μm) and ICC for Oct4 pluripotency marker. B Graph representing flow cytometry data for hESC and hiPSC culture expression of pluripotent surface markers SSEA4 (n=3) and TRA-1-60 (n=2). Error bars represent SD ± 1. C Diagram demonstrating the stages of the priming protocol. D Growth profile of the hES cell line over 7 days of culture expansion. E Growth profile of the iPS cell line over 7 days of expansion (Bars indicated Mean ± SEM). |