|
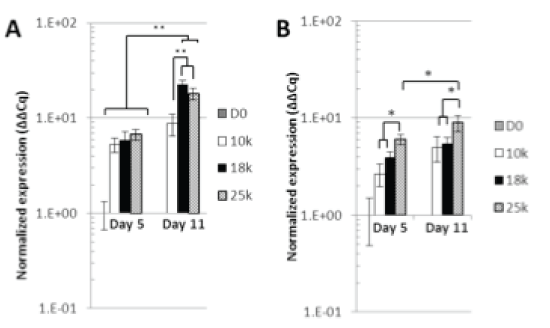
| Figure 3: qPCR analysis of the effect of ICSD on hESC and hiPSC fgf5 gene expression over the first 11 days of neuronal priming. Day 5 and day 11 columns represent fgf5 expression relative to day 0 at the different seeding densities. hESC fgf5 expression was shown to increase significantly over time for both 18 k/cm2 & 25 k/cm2. At day 11 10 k/cm2 was shown to have decreased expression relative to the other two ICSD. hiPSC did not show an increase over time for all ICSD. It was shown that 25 k/cm2 had significantly greater expression at both time points. (*p< 0.05 & **.p<0.01, Bars represent Mean ± SEM, n=3) |