 |
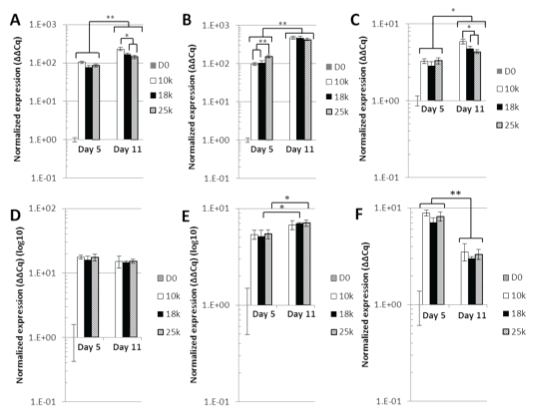
| Figure 4: qPCR analysis of the effect of ICSD on the expression of neuronal gene expression over the first 11 days of neuronal priming. Day 5 and day 11 columns represent neuronal gene expression relative to day 0 expression at the different ICSD. All neuronal genes screened for showed significant increases over day 0. hESC across all genes significant increases were observed across the time course. hiPSC was observed to have more stable expression levels from day 5 and day 11. Otx2 was observed to decrease significantly across the time course. (*p< 0.05 & **p<0.01, Bars represent Mean ± SEM, n=3) |