 |
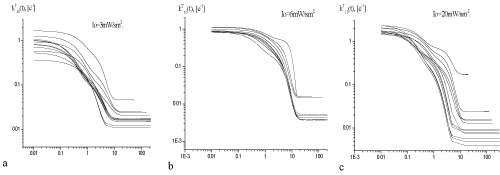
| Figure 2: Temporal variation of absorption of a water solution of RC complexes after the switching-out (t=0) of exciting light for various exposures (1, 5, 10, 20, 30, 40, 50, 60, 90, 120, 300, 600 s) and І0=3, 6, 20 [mW/cm2]. The less exposure durations correspond to higher positioned curves. |