 |
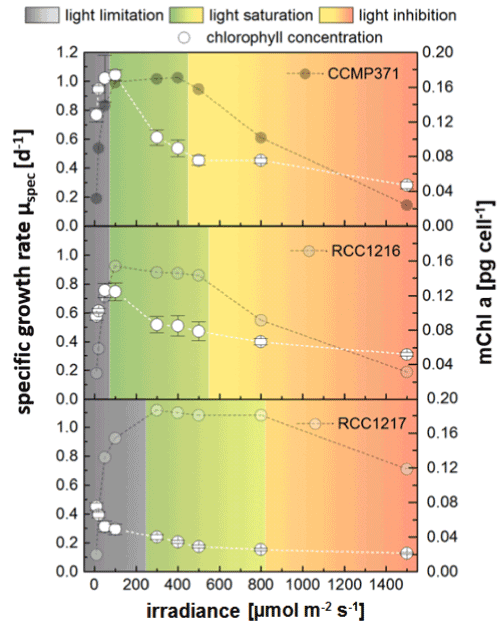
| Figure 5: P-I curves of cultivations under different illumination conditions expanded with averaged intracellular chlorophyll content during the exponential phase. Data originate from the exponential phase AFLR correlation (same samples as used for μspec determination). |