 |
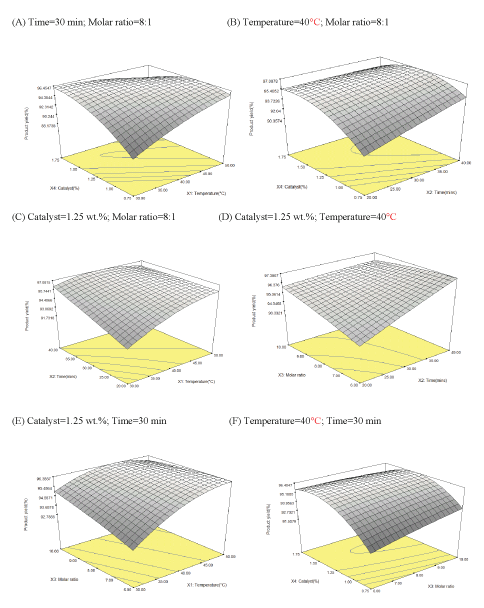
| Figure 2: The response surface plot of the camelina biodiesel product yield at different levels of experimental factors. (A) catalyst concentration and temperature; (B) catalyst concentration and time; (C) temperature and time; (D) time and molar ratio; (E) temperature and molar ratio; (F) catalyst and molar ratio. |