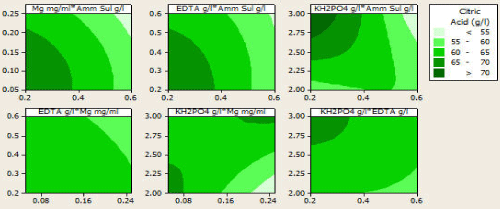
Figure 7:
Response contour plots of citric acid.