 |
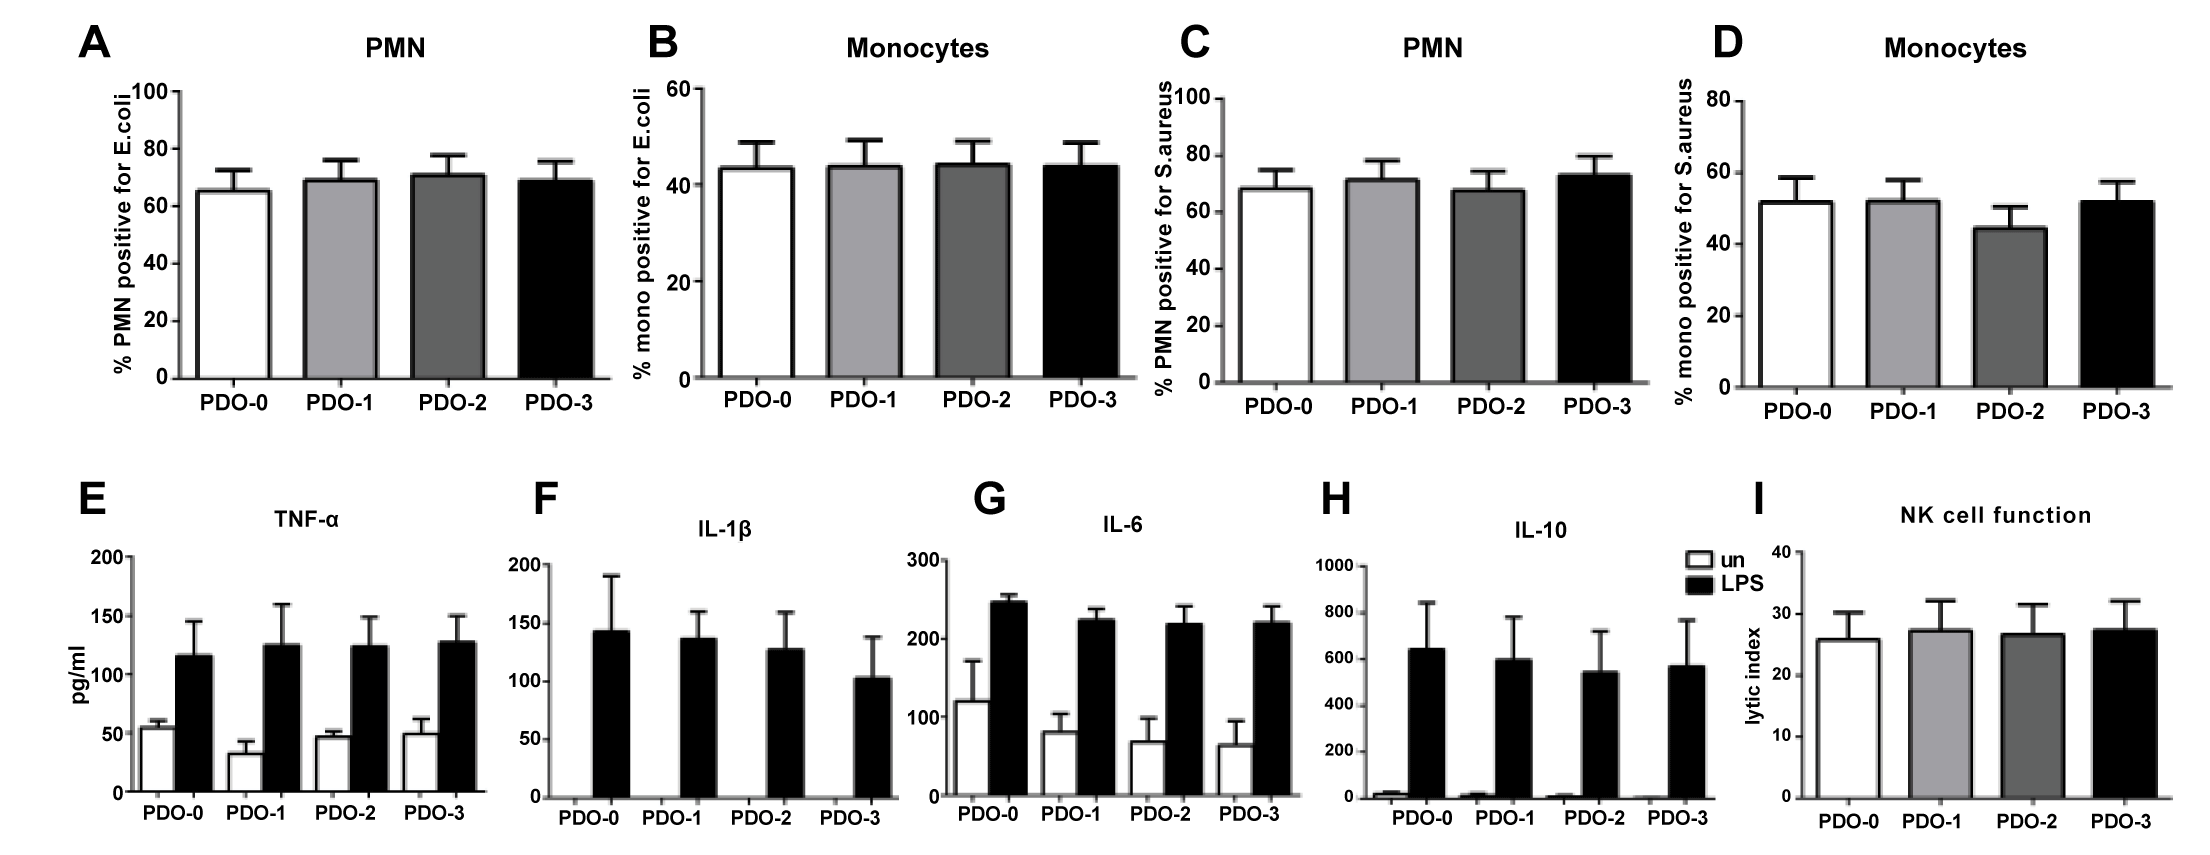
| Figure 1: PDO has no effect on the innate immune responses in vitro in human cells. Blood was exposed to 1, 2 or 3 PDO nano-fibers. The phagocytic capacity, cytokine secretion and NK cell cytotoxicity was determined. Bar graphs depict the phagocytic uptake of A & B. fluorescent E.coli bacteria C & D. fluorescent S. aureus bacteria by PMNs and monocytes respectively. E. F. G. & H. MNCs were stimulated with LPS in the presence or absence of PDO. Bar graphs depict the secretion of cytokines, TNF-α, IL-1β, IL-10 and IL-10. I. Bar graph depicts the lytic activity of NK cells. PDO-1, PDO-2, PDO-3 depict the number of fibers added/well. Data is mean +/- S.E. of 10 different subjects. |