 |
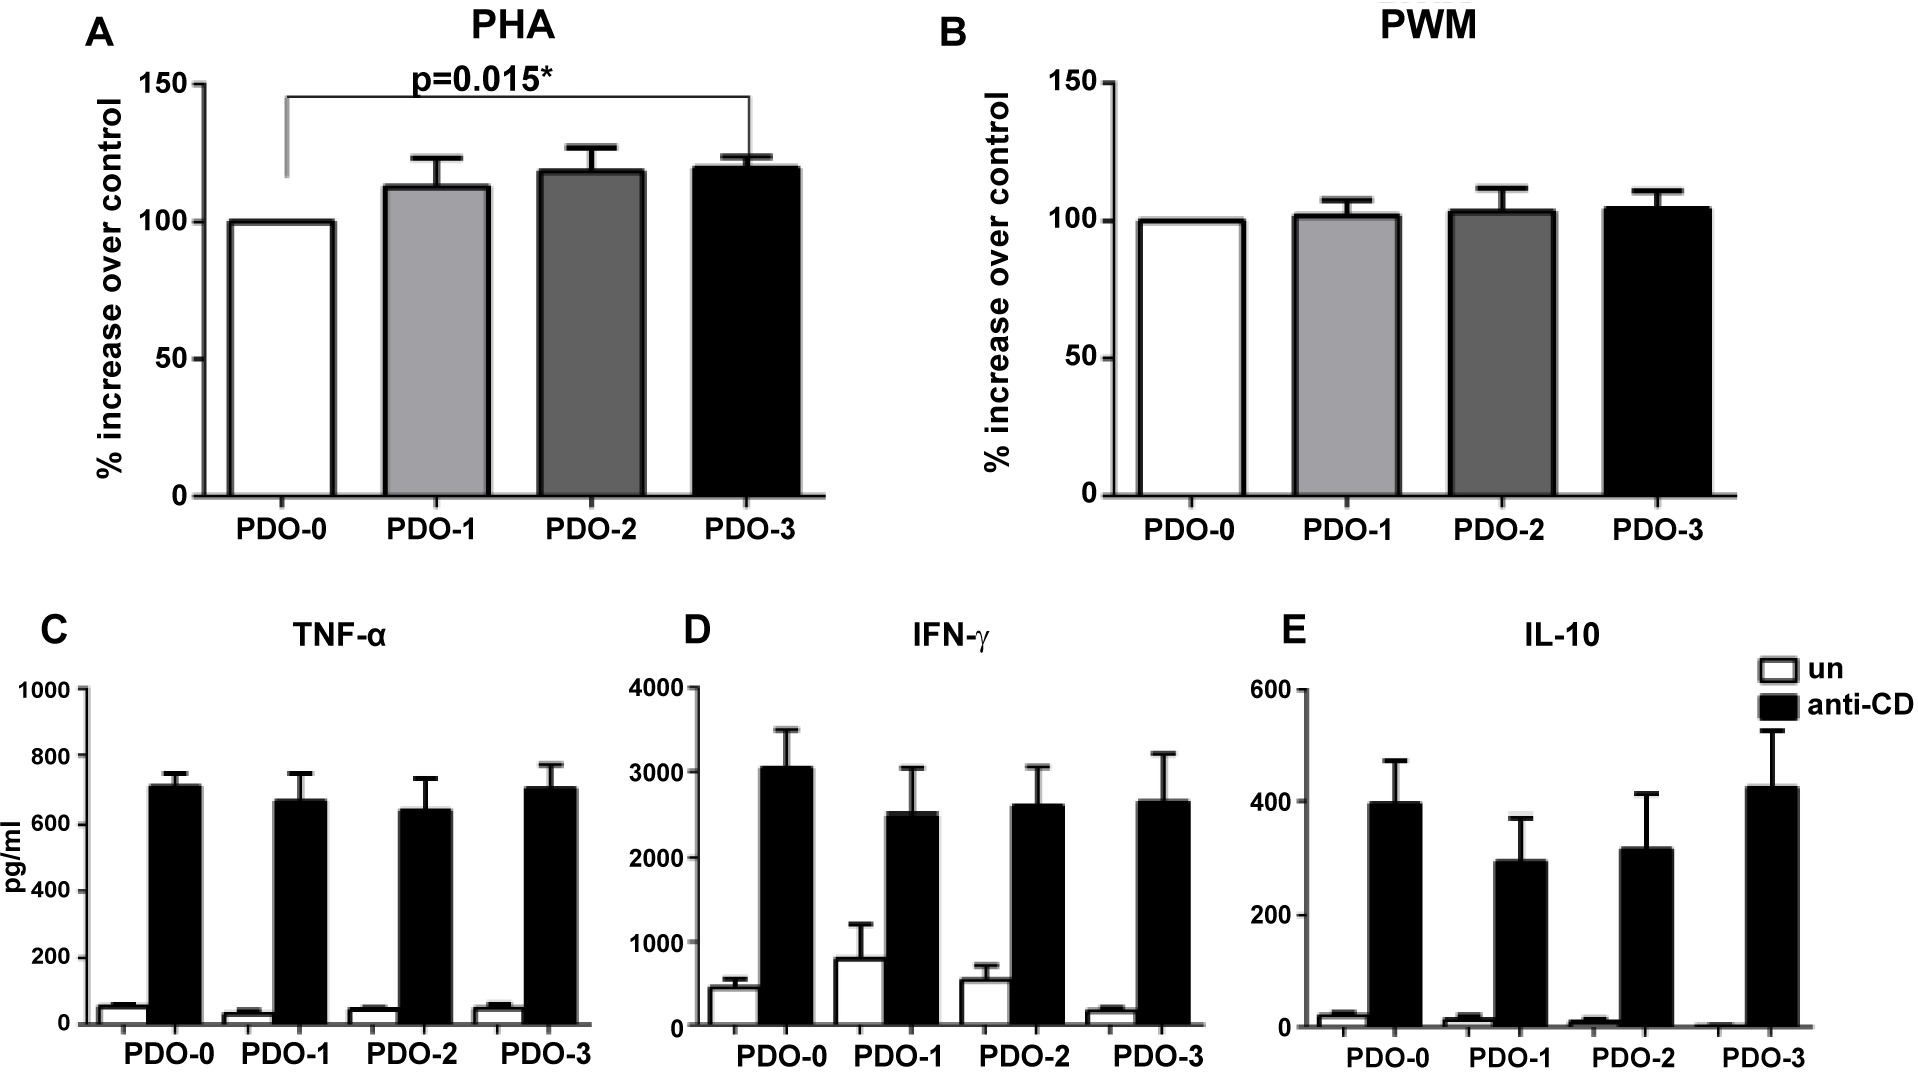
| Figure 2: Effect of PDO on adaptive immune responses in vitro. Blood was exposed to PDO nano-fibers and stimulated with PHA or PWM. The proliferation of lymphocytes was determined by thymidine [H]3 incorporation. Bar graph depicts percent increase after A. PHA stimulation. B. PWM stimulation. C, D, E. MNCs were stimulated with anti-CD3 and anti-CD28 in the presence or absence of PDO. TNF-α (C), IFN-γ (D) and IL-10 (E) secretion was measured by ELISA. Data is mean +/- S.E. of 10 different subjects. |