 |
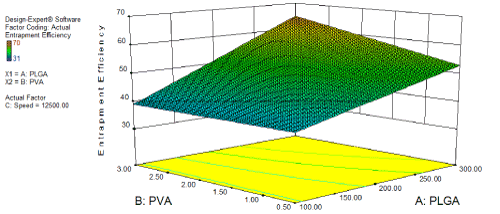
| Figure 4d: The contour plot of entrapment efficiency of nanoparticles prepared by PTX-PLGA for most significant factor AB. The plot shows the low level and high level (-1 to +1) of factor A and factor B when C is actual factor kept constant. From the graph it is demonstrated that the entrapment efficiency depends on the concentration of PLGA and PVA. |