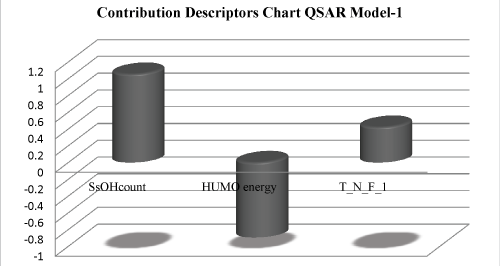
Figure 1:
Plot of contribution chart of 2D QSAR Model.