|
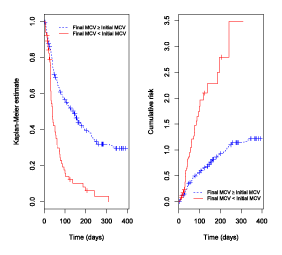
| Figure 2: Kaplan-Meier curves, according to treatment response based on the increase in MCV (final MCV>initial MCV). Patients compliant with treatment instructions return to the emergency room less frequently (left panel) and their risk of having recurrent crises is less than non-compliant patients (right panel). There is a significant difference between the curves in both panels (p<0.001). |