 |
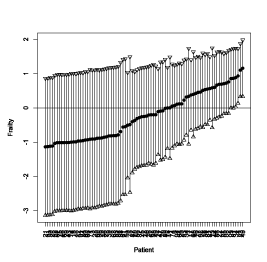
| Figure 3: Individual frailty. The y-axis shows the frailty measure (risk of visiting the emergency room) of a non-compliant patient. The distance between the upper-most line and the lowest-most line represents the confidence interval. The solid line shows the increase in the number of visits to the emergency of the patient in question overtime. As the confidence interval decreases, the risk of visiting the emergency room increases significantly. |