 |
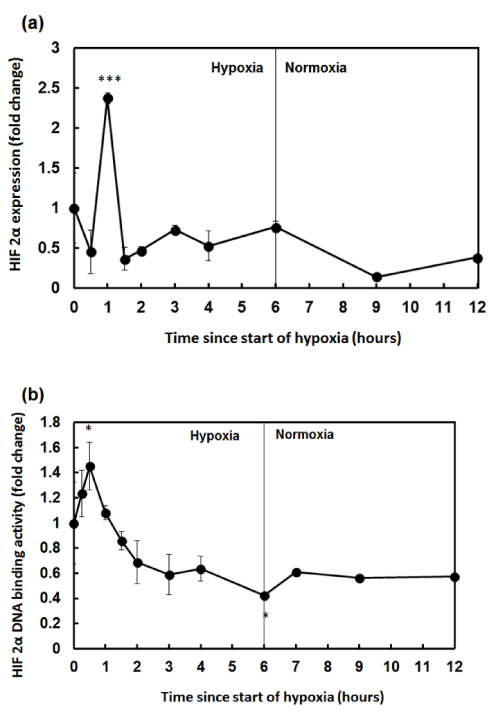
| Figure 3: (a) Mean ±SD (N=4) of HIF-2α protein expression in the kidney cortex of rats in response to 10 % hypoxia for 6 hours. (b) Mean ±SD (N=4) of HIF-2α DNA binding activity in the kidney cortex of rats exposed to the same hypoxia conditions. *Values significantly different compared with the control group (* P < 0.05, ** P < 0.01, *** P < 0.001). |