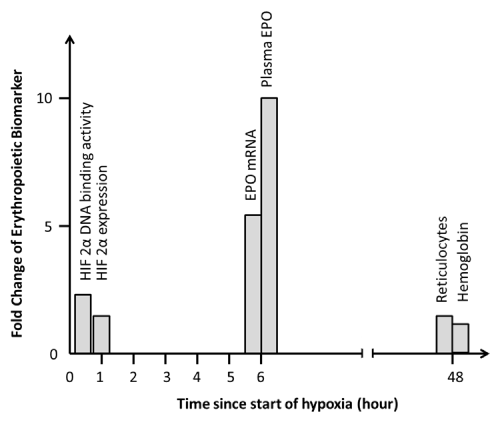
Figure 7:
Demonstration of the time line of the maximum fold change of each erythropoietic biomarker.