 |
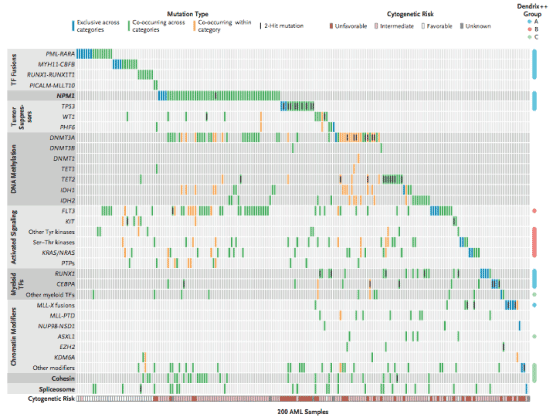
| Figure 3: Organization of Mutations into Categories of Related Genes: Almost all the sample displayed one mutation in one of the listed genes or sets. Blue boxes indicate mutations that are exclusive across all categories; green boxes, mutations that co-occur in the same sample across different categories; and orange boxes, mutations that co-occur in the same sample in the same category. Computational analysis identified three significant, mutually exclusive groups of genes, annotated on the right as groups A, B, and C. The cytogenetic risk for each patient is shown at the bottom of the chart (reproduced from Cancer Genome Atlas Research NEJM 2009 [52]). |