 |
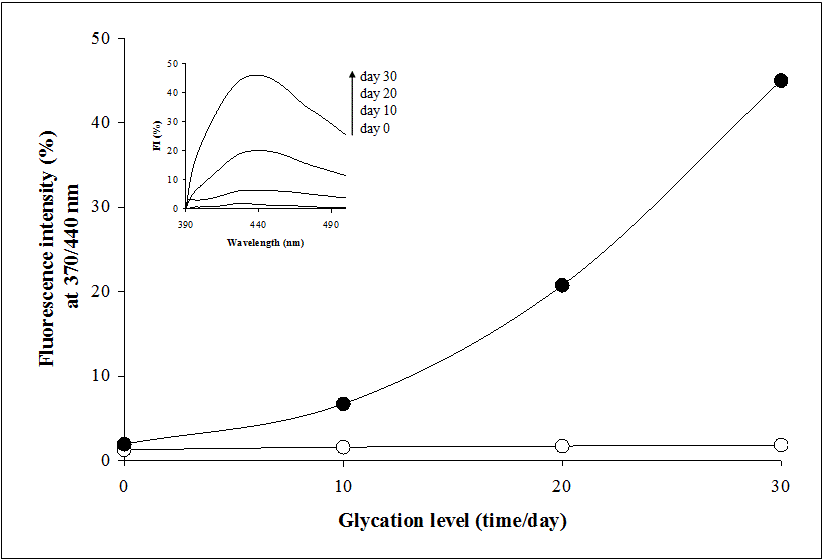
| Figure 1: AGE-related fluorescence properties of Hb. The emitted fluorescence intensity values for fructated Hb and controls are plotted as a function of time. Filled dots are AGE-Hb treated samples and empty dots are controls. In inset are shown AGErelated fluorescence properties of the haemoglobin incubated with fructose which were assessed through maximum emission peak at 440 nm after excitation at 370 nm. |