 |
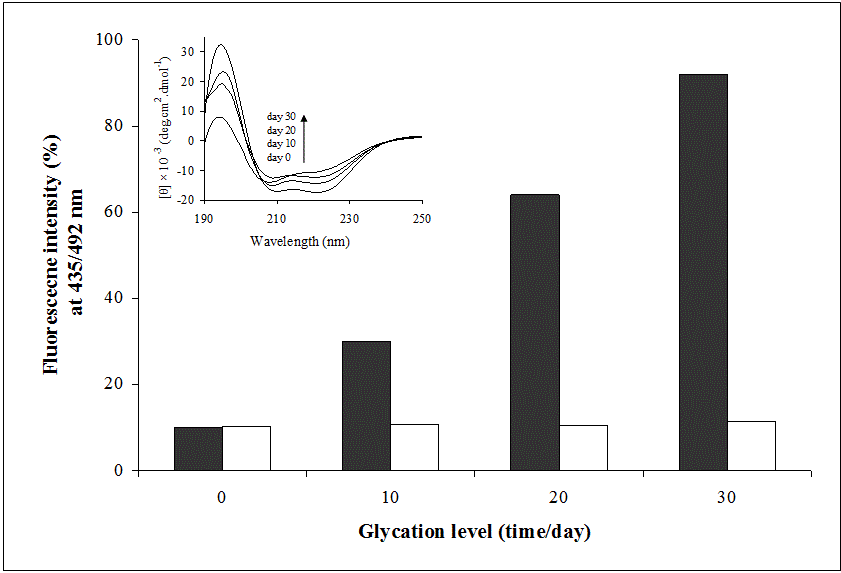
| Figure 2: The CD spectra at the far-UV region of AGE-Hb. ThTbinding
function against fructation time effect in which maximum
fluorescence emission was measured through excitation at 435nm
and spectra were recoded in the wavelength range of 455–555nm
for glycated Hb |