 |
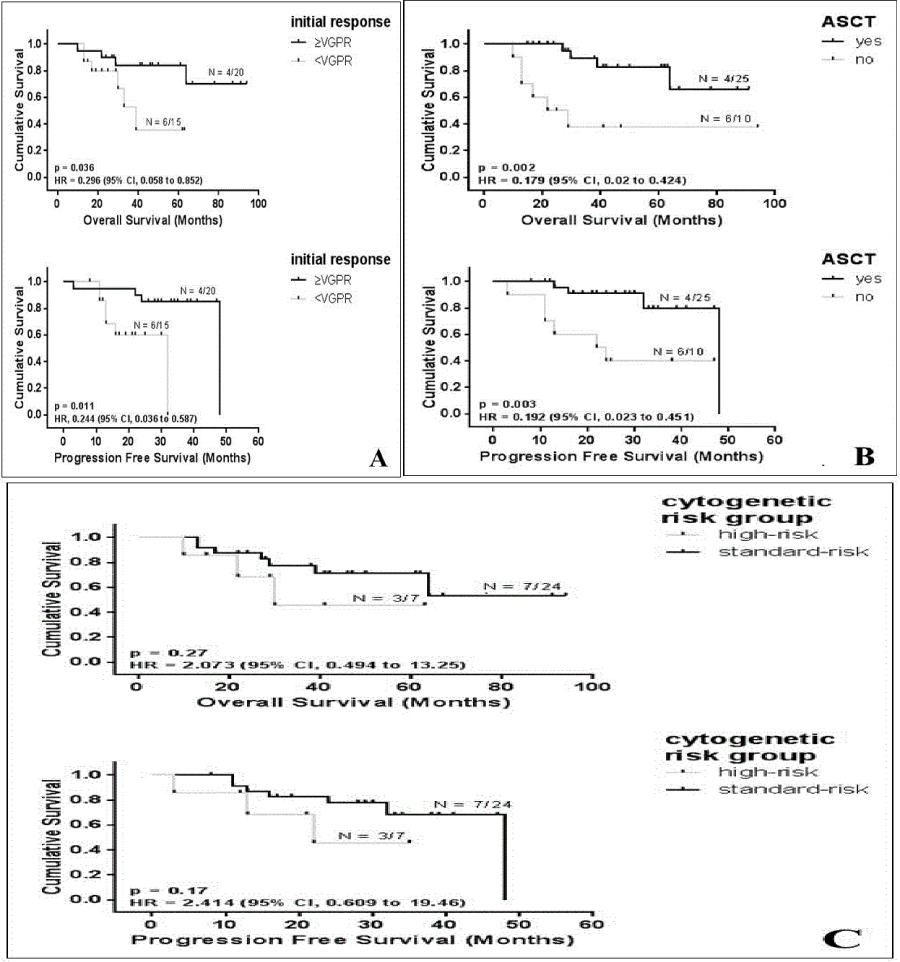
| Figure 1: Survival - results of subgroups of patients (pts.). A) Comparison of OS and PFS between pts. with a≥VGPR and pts. with a <VGPR; 35 pts.. Both OS and PFS were significantly longer in pts. with a≥VGPR (p values <0.05). B) Comparison of OS and PFS between pts. who underwent ASCT (ASCT yes) or not (ASCT no); 35 pts. Both OS and PFS were significantly longer in pts. who underwent ASCT (p values <0.05). C) Comparison of OS and PFS based on cytogenetic risk groups (high-risk vs. standard-risk); 31 pts. P values <0.05 indicate statistical significance (log rank). OS and PFS are time-to-events data. N=number of events/number of pts. HR=Hazard ratio. |