|
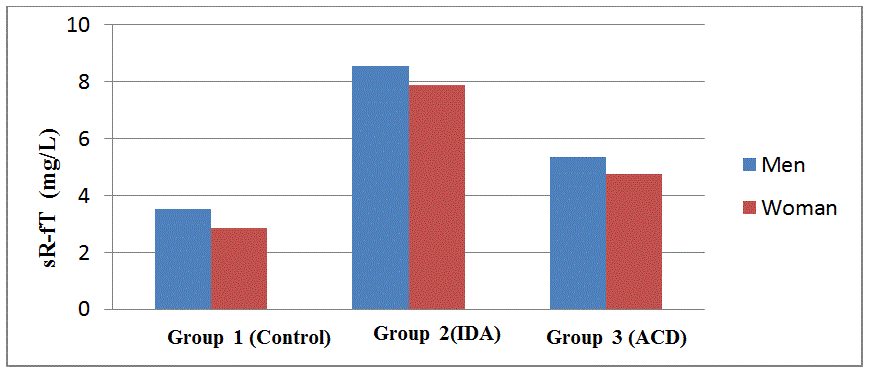
| Figure 5: Concentrations of soluble transferrin receptor sT-fR in mg/L in Group 1 (control) (n=40: 22M/18W) and two groups of anemic subjects: Group 2 to iron deficiency anemia (IDA) (n=30: 11M/19 W); Group 3: anemia of chronic disease (ACD) (n=60: 36M/24W). |