 |
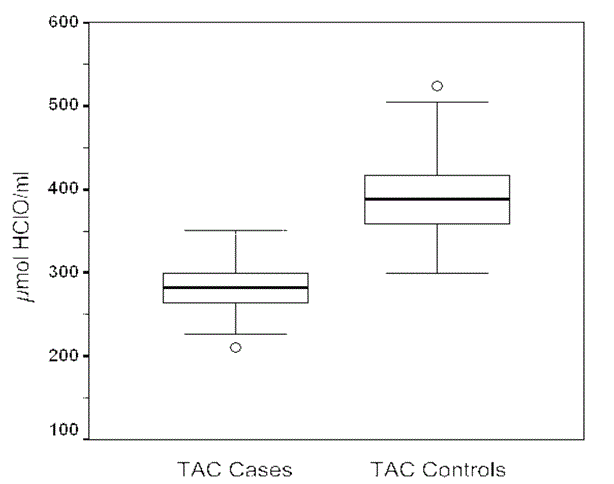
| Figure 1: Basal M-ROMs (a) and m-TAC (b) levels depicted as boxplots of hematological patients (Cases) and healthy controls (Controls). Each box-plot depicts the median (middle line), the values from the upper to lower quartiles (central box) and the upper/lower quartile ± 1.5 × interquartile range (horizontal lines) of one category. Outliers (i.e. values outside these borders) are depicted as circles p<0.001. |