 |
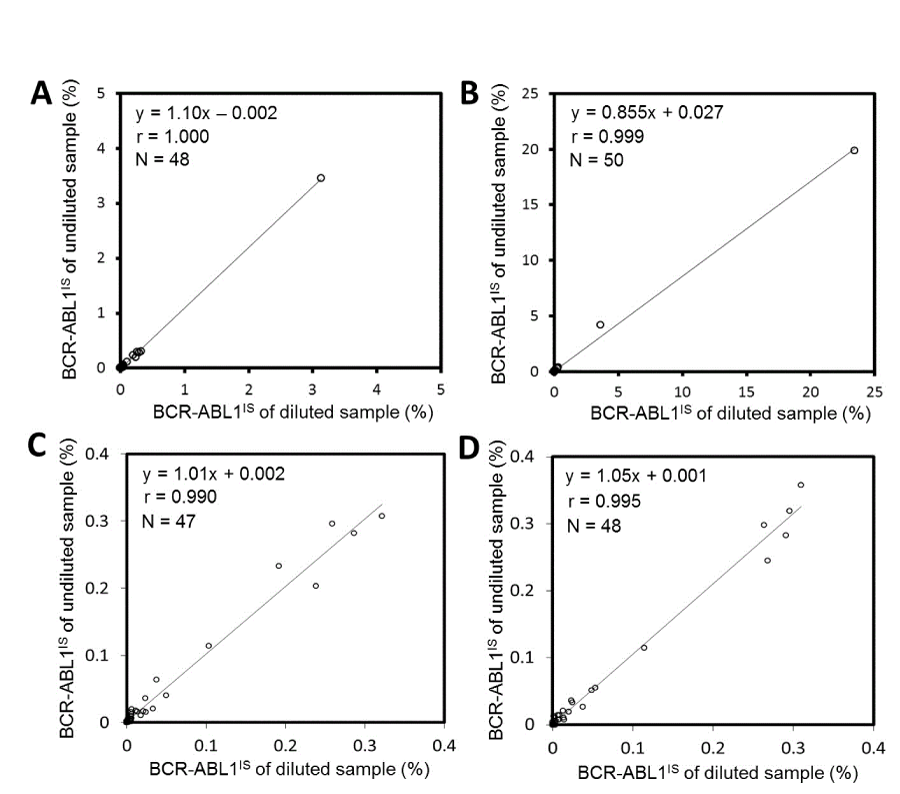
| Figure 6: Correlation between BCR-ABL1IS of diluted and undiluted samples. Correlation analyzed between BCR-ABL1IS of diluted (100 ng/μl) and undiluted samples obtained from the 7-ml PB sample. A: Samples in entire measurement range, C: Samples up to 1%) and 14-ml PB sample. B: Samples in entire measurement range, C: Samples up to 1%). |