|
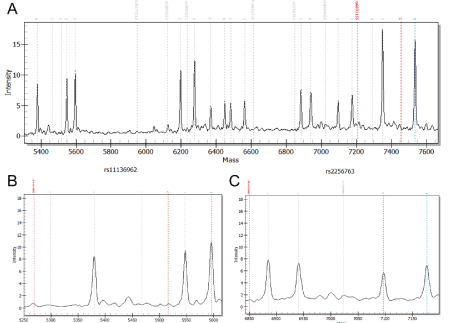
| Figure 1: Examples of MassARRAY iPLEX data. Figure A shows a multiplexed (10 assays) MALDI-TOF spectrum of ChimericID Panel data. Figures B and C shown the assays that are homozygous (B) and heterozygous (C). In B and C the SNP-related peaks are highlighted with blue and red dashed lines. |