 |
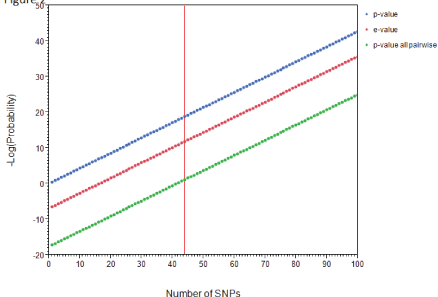
| Figure 2: Relationship between the number of SNPs in the panel and the probability of a random positive match between any two unique samples, expressed as a p-value (blue trace), the expected number of false positives for the population of an entire planet (red trace), and the probability of a random positive match considering all pairwise comparisons for the world population (green trace). |