 |
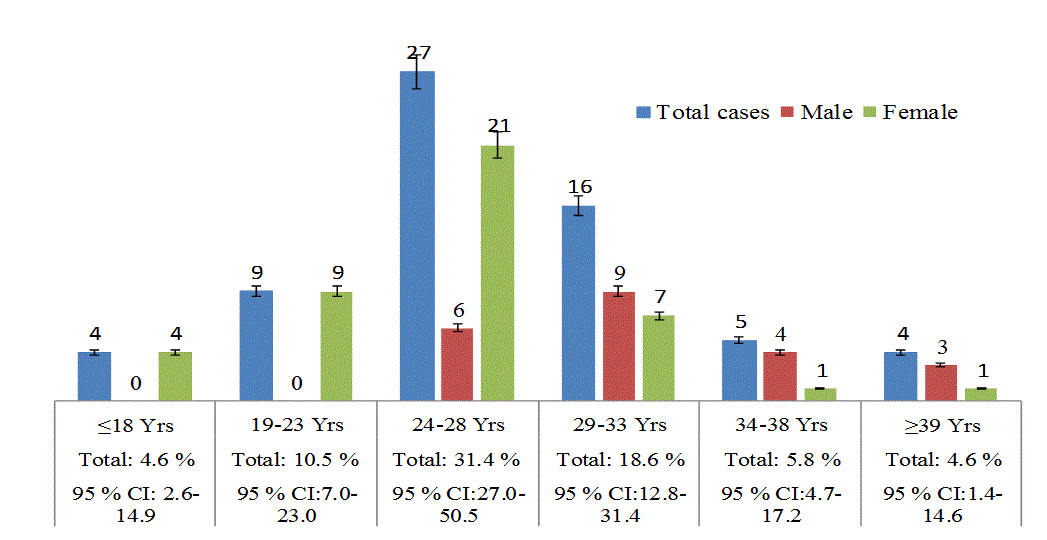
| Figure 1: Age and sex specified overall HSV prevalence is presented in this figure. (Each column is propagated with HSV infection incidence from each age and sex groups. Total% prevalence of HSV infection from each age group is enlisted with their 95% confidence interval. The HSV positivity among 65 subjects is distributed statistically very significant (p<0.001). The error bar of each age and sex group is created with 5% of selected data chart.) |