 |
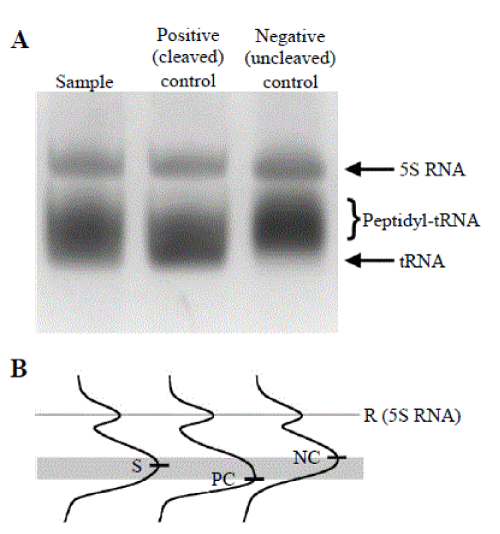
| Figure 1: Analysis of migration distance versus intensity. A) A typical methylene blue stained acid urea gel showing peptidyl-tRNA cleavage by a Pth. B) Lane traces generated by ImageJ and aligned using the 5S RNA internal reference band (R). Peak maxima are designated by the following parameters: uncleaved negative control (NC); unknown sample (S); and cleaved positive control (PC). |