 |
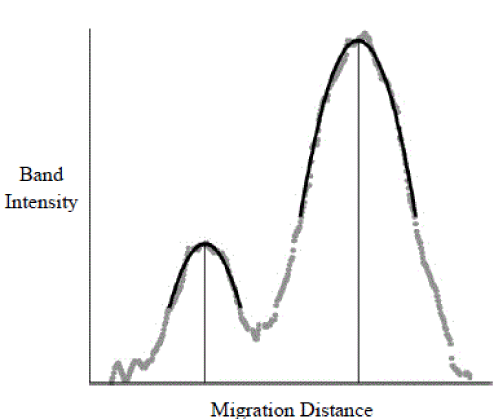
| Figure 3: Determination of peak maxima. Peak maxima are determined from polynomial fits to the intensity profile. Experimental data are shown as gray circles and the fitted curve is a black line. Locations of maxima are indicated by vertical lines. Units are arbitrary. |